
Question 1
A lead–tin thermal-equilibrium phase diagram is shown.
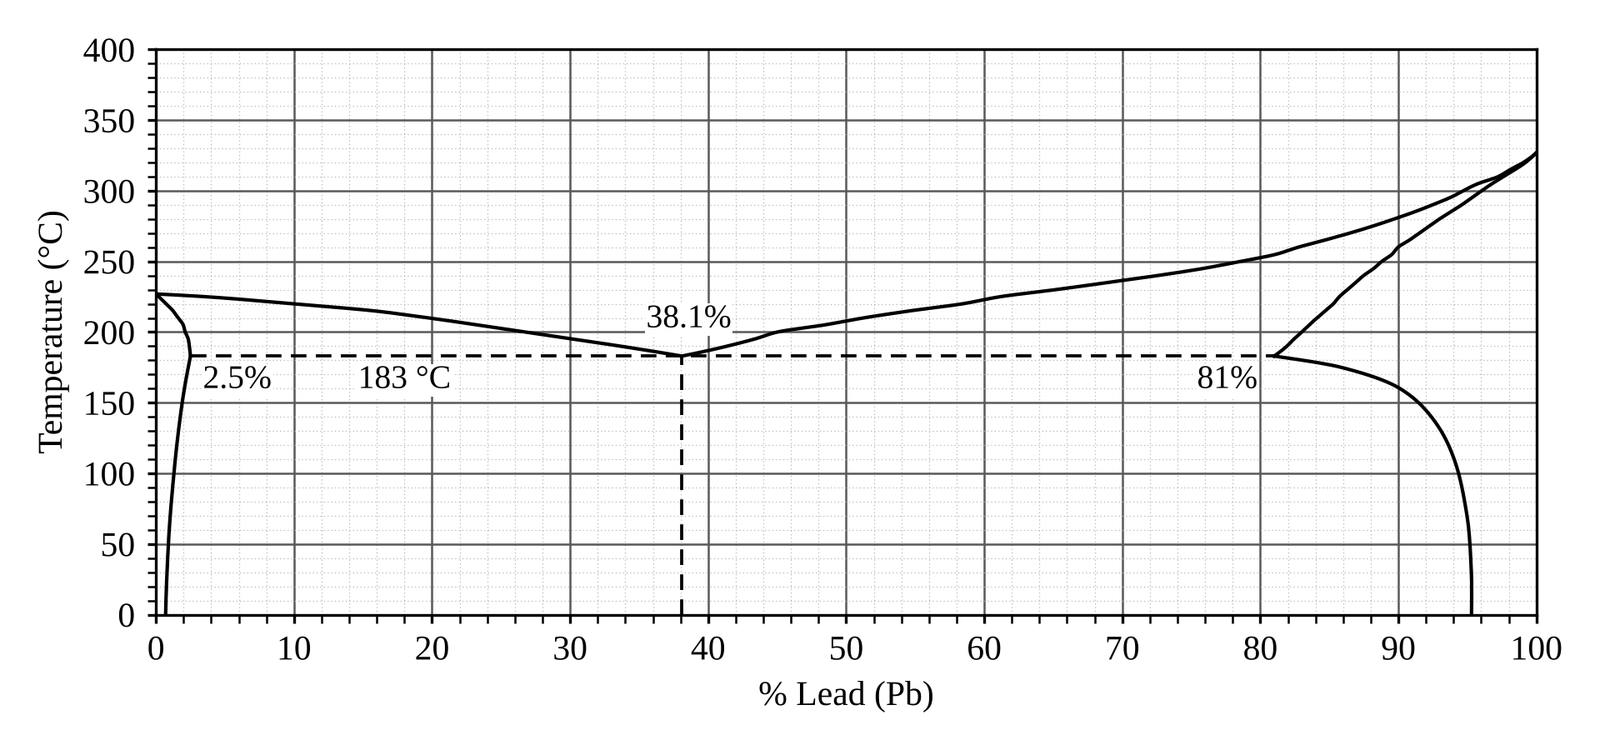
What phases would be present in an alloy containing 20% Pb at a temperature of 200 °C?
Not quite. You picked L only, but that is the field above the liquidus. At 20% Pb that starts at about 210 °C, not 200 °C.
Not quite. $\alpha+\mathrm{L}$ is the matching field on the lead-rich side of the diagram. You have $\alpha$ and $\beta$ swapped.
Not quite. $\alpha+\beta$ is the fully solid field below the 183 °C eutectic line. Your alloy is at 200 °C, above that line.
That is it. Step through the hints below to see why.
The printed diagram redrawn. Shaded: the phase field of the option you are testing. The dotted lines run from your alloy, 20% Pb at 200 °C, to both axes. Testing (D) also draws the tie line across the field at 200 °C.
At 20% Pb the L field only starts at the liquidus, at about 210 °C. Your alloy at 200 °C sits below it, outside the shaded field. Not this one.
The shaded $\alpha+\mathrm{L}$ field is the matching field on the lead-rich side, far to the right of 20% Pb. Not this one.
The shaded $\alpha+\beta$ field lies wholly below the dashed 183 °C line. Your alloy at 200 °C is above that line. Not this one.
Your alloy sits inside the shaded field, between the $\beta$ solidus at about 2% Pb and the tin-rich liquidus at about 27% Pb. This is the one.
This diagram counts % Lead (Pb) along the bottom, so the tin-rich side is on the left.
Convention (as in QCAA papers): $\alpha$ is the lead-rich solid and $\beta$ is the tin-rich solid.
At 200 °C the 20% Pb point lies between the $\beta$ solidus (about 2% Pb) and the tin-rich liquidus (about 27% Pb), above the 183 °C eutectic line.
$$2\%<20\%<27\%\ \Rightarrow\ \beta+\mathrm{L}$$
Between solidus and liquidus the alloy is part solid, part liquid, and on the tin-rich side of the eutectic the solid is $\beta$.
At 200 °C the 20% Pb point lies between the $\beta$ solidus (about 2% Pb) and the tin-rich liquidus (about 27% Pb), above the 183 °C eutectic line.
$$\beta+\mathrm{L}$$
The past QCAA questions this one was modelled on
Only mark this done when you could do it without help. Reading the solution does not count.
A Tangent Tuition mock exam question. It is not a past QCAA question, and Tangent Tuition is not affiliated with the QCAA.
Spot a mistake on this page? Report it