
Question 1
The graph shows the tensile stress–strain curves of four different materials.
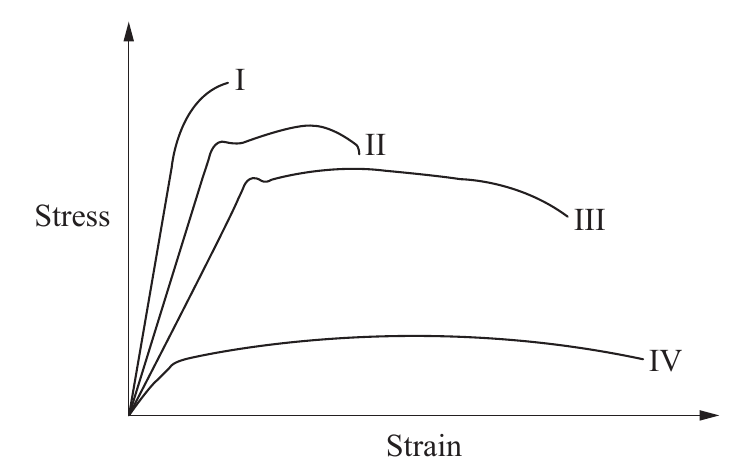
The toughest of the four materials is
Not quite. I reaches the highest stress, so it is the strongest, but it breaks after a very short strain. Toughness is the area under the whole curve, and I encloses the least area of the four. In 2022, 23.6% of Queensland students chose (A).
Not quite. II is high, but it stops at about half the strain III reaches. Its area is only about three fifths of III’s. In 2022, 6.5% of Queensland students chose (B).
That is it. Step through the hints below to see why. In 2022, 60.2% of Queensland students chose (C).
Not quite. IV stretches furthest, so it is the most ductile, but it stays close to the strain axis the whole way. Long and low encloses less area than III, which runs almost as far at about three times the stress. In 2022, 9.4% of Queensland students chose (D).
Toughness is the energy a material absorbs before it breaks. On a stress-strain diagram that is the area under the whole curve, from the origin to fracture.
$$\begin{gathered}\text{toughness}\\=\text{area under the curve}\end{gathered}$$
So the question is asking which curve encloses the most area.
Area needs height and length together. I is the tallest but the shortest. IV is the longest but the lowest. III stays high and runs almost as far as IV.
The top curve wins on strength. The longest curve wins on ductility. Neither of those is toughness.
Measured from QCAA’s figure, with III’s area as 100%:
$$\begin{gathered}\text{III}=100\%\quad\text{II}\approx59\%\\\text{IV}\approx39\%\quad\text{I}\approx25\%\end{gathered}$$
III encloses the most area, so it is the toughest.
Toughness is the area under the curve. III is nearly as high as II and runs much further, so it encloses the most area. I peaks highest but breaks early, and IV runs furthest but stays low.
The most common wrong answer was (A), the tallest curve. The highest peak is the ultimate tensile strength, a strength reading. Toughness needs the area, so a curve that breaks early loses however high it climbs. Stress-strain diagrams are reduced content in the 2025 syllabus, yet one appeared in every paper from 2020 to 2025.
Only mark this done when you could do it without help. Reading the solution does not count.
Question wording and any figures are from the 2022 QCAA Engineering external assessment, © State of Queensland (QCAA) 2022, licensed under CC BY 4.0, and have been adapted, except where a third-party source is named. Tangent Tuition is not affiliated with the QCAA.
Spot a mistake on this page? Report it