
Question 11
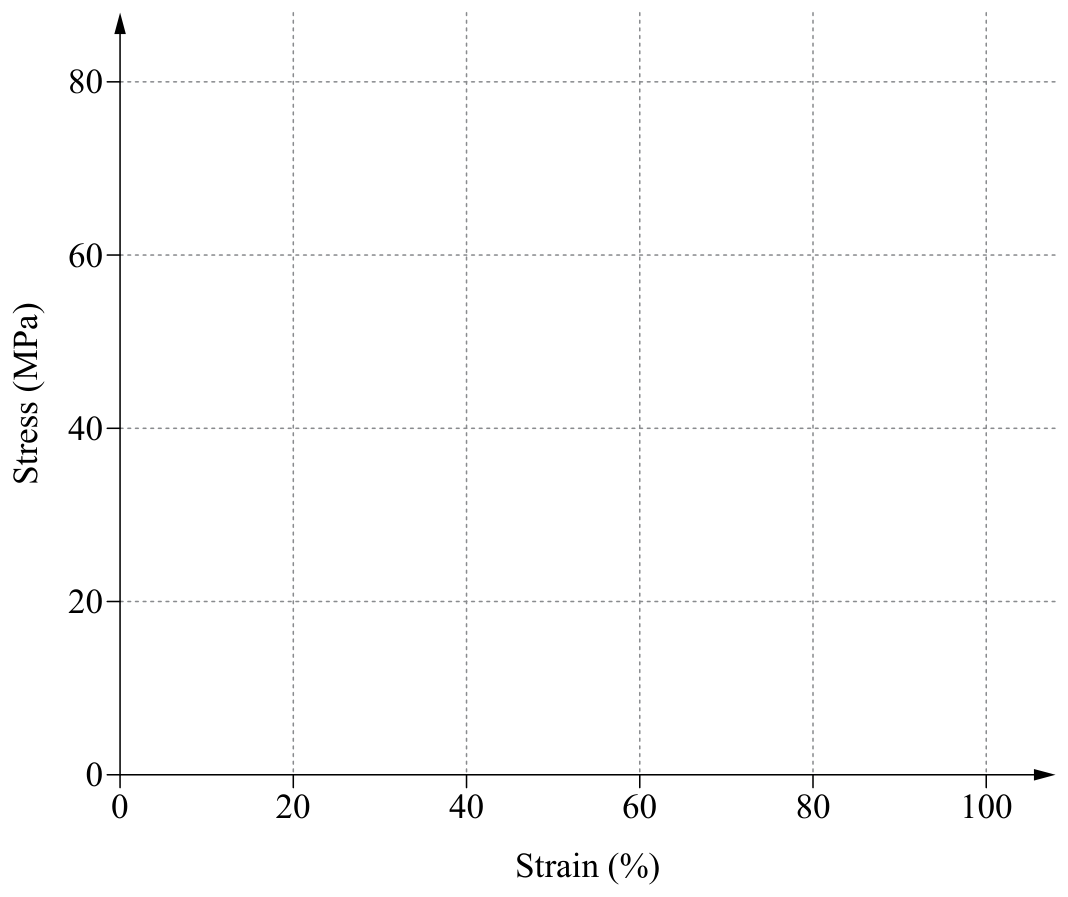
Sketch the stress–strain curve for nylon on the graph. Clearly label the features that indicate the material’s ability to absorb and store energy and to withstand elastic deformation within the material’s proportional limit.
[4 marks]
Stiffness is the gradient of the straight line and toughness is the area below the whole curve
These are QCAA’s printed axes with the curve from QCAA’s sample answer drawn on them. Watch where the straight line ends and where the curve stops, then watch the two features being labelled.
Within the proportional limit the line is straight, and its gradient tells you how well nylon withstands elastic deformation. Every unit of area below the curve is energy absorbed, so the area up to rupture is the toughness.
Shape the curve, label the two features and watch the criteria tick
Drag the two handles, or use the sliders, to move the end of the straight line and the rupture point. Then pick a label and tap the part of the graph it belongs to. The curve starts as QCAA’s sample.
Work through the solution one mark at a time
Try each step yourself before you reveal it. Two marks are for the shape of the curve and two are for the labels.
Start at the origin with a straight, steep line. End it well before the 20 grid line on the strain axis. QCAA’s sample ends it at about 13% strain and 47 MPa.
Marker: sketches an appropriate stress–strain curve for nylon, including a straight line proportion with strain less than 20%
Bend the curve over, let it level off and stop it clearly, before the 80 grid line. QCAA’s sample levels at about 59 MPa and ruptures at about 43% strain. Nylon stretches a long way, but it is not a rubber.
Marker: sketches an appropriate stress–strain curve for nylon, including a rupture point with less than 80% strain
“The ability to absorb and store energy” is toughness. Label the area below the whole curve, from the origin to the rupture point.
“The area below the total curve must be used to indicate toughness …”
QCAA’s sample closes off the area with a dashed arrow from the rupture point down to the strain axis and writes “toughness” beside it. Shading the area makes the same point more clearly.
Marker: accurately identifies toughness on the curve
“The ability to withstand elastic deformation within the material’s proportional limit” is Young’s modulus, the stiffness. Label the gradient of the straight section, for example with a slope triangle. This is QCAA’s sample sketch.
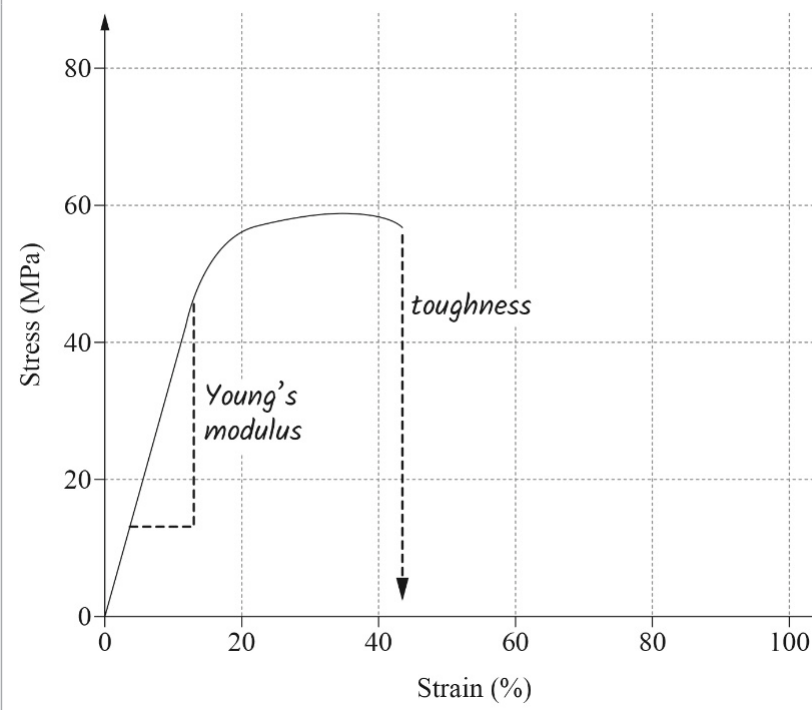
“For Young’s modulus, accept stiffness, i.e. identifying the material’s ability to withstand deformation within its proportional limit. … within the proportional limit to indicate Young’s modulus or stiffness.”
Marker: accurately identifies Young’s modulus on the curve
Each phrase of the question gave you something
The 2021 subject report does not discuss Question 11 by number. Its advice for later cohorts asks for an in-depth knowledge of stress-strain diagrams and defines Young’s modulus as stiffness, the ability to withstand elastic deformation within the proportional limit, and toughness as the ability to absorb and store energy. Those are the two phrases this stem is built from (2021 subject report).
QCAA did not publish a band for this question. It reads as simple familiar because the axes are supplied and both features are named through their textbook definitions. For 2026, QCAA’s Engineering 2025 syllabus revision report (July 2024) lists stress-strain diagrams as reduced subject matter in Unit 4, the unit the external exam covers. My advice from that change is to expect a supplied curve to read more often than a sketch on printed axes like this one. QCAA has not said what the 2026 paper will ask, so keep the skill. Nylon is still in Unit 4 as PA6, and reading toughness and stiffness off a supplied curve is what 2025 Question 14 asked.
If I had to guess where you might lose marks, it would be putting “toughness” on the highest point or shading only the triangle under the straight line. The notes say the area below the total curve must be used. The other trap is the stem’s wording. It never says toughness or Young’s modulus, so you have to translate “absorb and store energy” and “withstand elastic deformation” into those two names before you label anything.
Only mark this done when you could do it without help. Reading the solution does not count.
Question wording, any figures and marking-guide steps are from the 2021 QCAA Engineering external assessment, © State of Queensland (QCAA) 2021, licensed under CC BY 4.0, and have been adapted, except where a third-party source is named. Tangent Tuition is not affiliated with the QCAA.
Spot a mistake on this page? Report it